Trust, Verified: The Statistical Logic That Lets Voters Check Close Elections
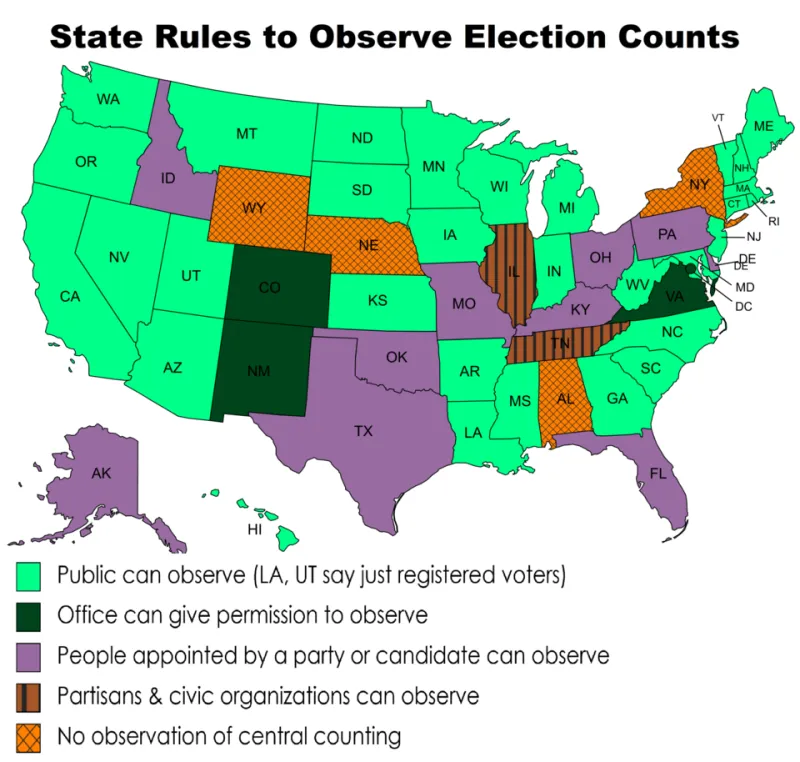
Photo: Numbersinstitute, CC BY-SA 4.0, via Wikimedia Commons
Election night invites a familiar ritual of suspense: precincts report, margins narrow, and commentators begin speaking in probabilities. By the time the 2026 midterms are fully analyzed, many Americans will have encountered a result that was close enough to invite doubt. The question is not whether doubt is natural. It is whether the public has the statistical vocabulary to evaluate the answer.
That is where risk-limiting audits enter the conversation. Often shortened to RLAs, these procedures use random sampling and hypothesis testing to verify that a reported election outcome is consistent with the paper record. They do not replace recounts, and they do not ask voters to trust a black box. They offer a transparent mathematical argument about how much evidence is enough.
Election Night Is a Probability Problem in Disguise
A close election is not simply a political event. It is a measurement problem. Ballots are counted by machines, aggregated by software, and reported through layers of human and technical systems. Most of the time those systems agree. In a tight race, however, even a small discrepancy can matter.
A risk-limiting audit begins with a simple but powerful question: if the reported outcome were wrong, how likely is it that a random sample of ballots would reveal the problem? The audit is designed so that this probability is bounded. The bound is called the risk limit. A risk limit of 5 percent, for example, means that the audit has at most a 5 percent chance of failing to detect a wrong outcome and allowing certification to proceed. It does not mean that the outcome is 95 percent certain in some vague sense. It means something more specific and more useful: the procedure has a known maximum error rate.
What a Risk-Limiting Audit Actually Tests
The statistical framing is a hypothesis test. The null hypothesis is that the reported outcome is incorrect and that the true winner is different. The alternative is that the reported outcome is correct. Auditors draw a random sample of paper ballots, compare the sampled ballots with the reported totals, and calculate whether the evidence is strong enough to reject the null hypothesis.
If the sample contains no discrepancies, or only discrepancies that do not threaten the reported winner, the audit may stop early. If the sample contains discrepancies that could change the outcome, the audit expands. In the extreme, it can escalate to a full recount. The procedure is therefore adaptive: it spends more effort where the evidence is weaker.
This is why the paper record matters. An RLA is not a second guess about voter intent. It is a check between two representations of the same contest: the digital tally and the physical ballot. The mathematics does not decide who won. It decides how much checking is justified before certification.
The Arithmetic of a Sample
The sample is not chosen casually. It is drawn using a public random seed, often generated in a ceremony that can be observed by candidates, journalists, and members of the public. The ballots are selected from a manifest that lists every ballot or batch. The goal is to give every eligible unit a known chance of selection.
The calculations can become intricate, but the core idea is accessible. Imagine a contest with a narrow margin. If the reported winner is truly ahead, most random samples should reflect that lead. If the reported winner is not truly ahead, a random sample is more likely to contain enough discrepancies to trigger a larger audit. The probability of missing a wrong outcome shrinks as the sample grows.
Different RLA methods use different statistical models. Some are based on ballot polling, some on ballot comparison, and some on batch comparison. They may use hypergeometric distributions, sequential testing, or Bayesian methods. The details matter to election officials and statisticians, but the civic principle is consistent: the audit should state its assumptions, publish its sampling method, and report its risk limit in advance.
Why the Risk Limit Matters
A risk limit is not a promise that every error will be caught. No audit can promise that. It is a quantified statement about the procedure's reliability. That distinction is important in public discussion. When officials say an audit was conducted at a 5 percent risk limit, the public should hear a precise claim about the probability of certifying a wrong outcome, not a general assurance that everything is fine.
This is also where statistical literacy becomes civic literacy. Citizens can reasonably ask several questions. What was the risk limit? Was the sample drawn randomly and publicly? Was the ballot manifest complete? Were discrepancies investigated and reported? Did the audit expand when the evidence required it? These questions do not require a degree in statistics, but they do require familiarity with the logic of sampling and hypothesis testing.
Civic Statistical Literacy for 2026 and Beyond
For educators, election audits are an unusually rich teaching case. They connect probability, sampling, hypothesis testing, and public reasoning. They also demonstrate that mathematics is not confined to the laboratory or the finance desk. It is part of how institutions earn trust.
A classroom need not simulate a full statewide audit. Students can begin with a jar of colored tokens and a reported count. They draw samples, compare results, and ask how many samples would be needed to detect a deliberate error. They can vary the margin, the risk limit, and the sample size. They can see that a close contest demands more evidence than a landslide. They can also see that a statistical claim is only as good as the procedure behind it.
As the 2026 midterms are analyzed, the most valuable public skill may not be predicting outcomes. It may be evaluating the methods used to verify them. Risk-limiting audits turn election night nerves into a testable statistical question. That is a lesson in mathematics, and it is also a lesson in how a democracy can check its own work.